
About this sample
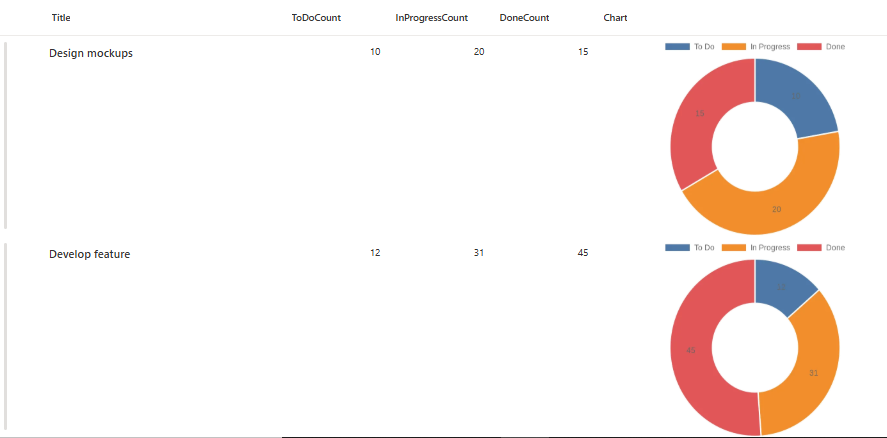
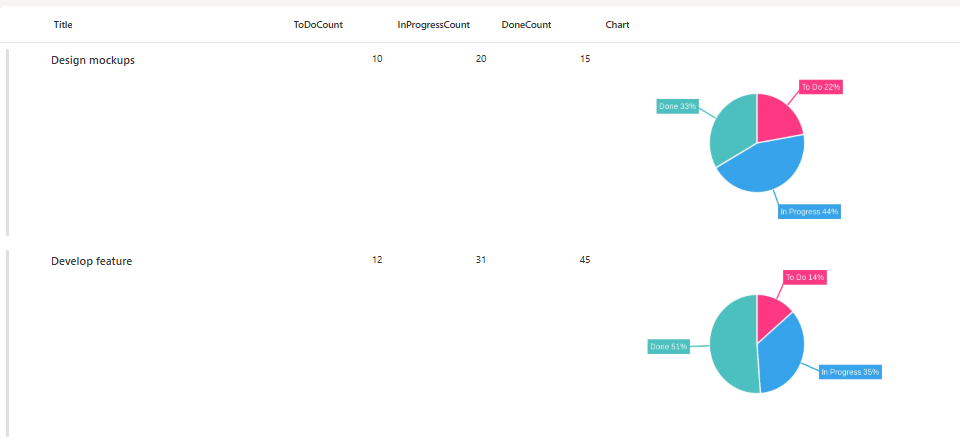
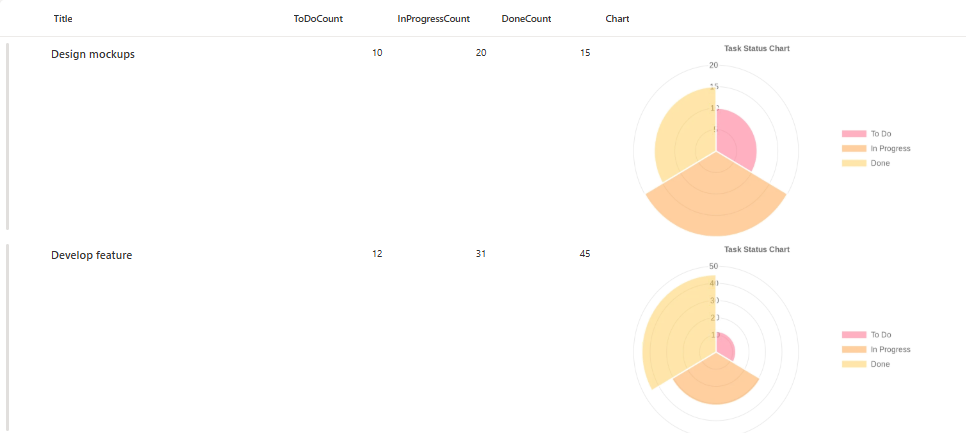
This sample uses SharePoint column formatting to automatically generate multiple chart types (pie, doughnut, out-labeled pie, and polar area) visualizing task status distribution across To Do, In Progress, and Done states.
Products & metadata
SharePointMicrosoft ListsColumnSharePoint OnlineChartsGeneralColumn Formatting